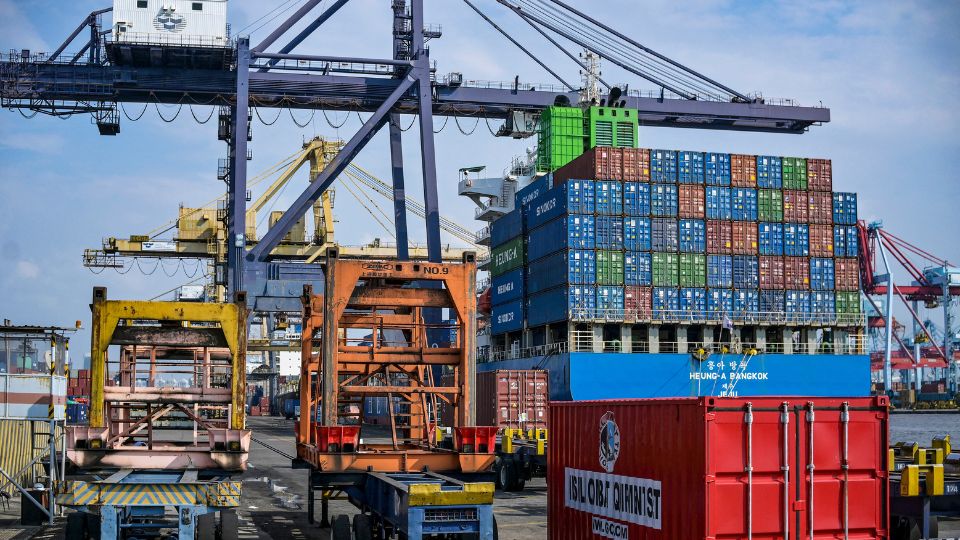
China has tightened its hold on Indonesia’s economy, emerging as the largest buyer of non-oil exports (22.64%) and the largest source of non-oil imports (40.35%) of Indonesia’s trade from January to July 2025.
China is Indonesia’s top buyer of non-oil exports (22.64%) and largest non-oil supplier (40.35%) in Jan–Jul 2025, with $34.46 billion of exports to China and $47.67 billion of imports from China.
Trade data from January to July 2025 underscore Beijing’s central role in Southeast Asia’s largest economy.
China accounted for 22.6 percent of Indonesia’s non-oil and gas exports and 40.3 percent of its non-oil imports during the first seven months of 2025.
China at Both Ends of the Ledger
On the export side, the main shipments were steel, nickel and related products, and mineral fuels. On the import side, the largest increase came in machinery and electrical equipment (+10.04% YoY).
Indonesia’s total exports from January to July reached $160.16 billion, up 8.03 percent from the same period in 2024.
Non-oil and gas exports rose 9.55 percent to $152.20 billion, while oil and gas exports fell 14.56 percent.
By sector, manufacturing exports grew 17.40 percent, while agriculture, forestry, and fisheries posted a sharp 43.62 percent increase.
Mining exports dropped 25.65 percent, largely due to weaker mineral fuel shipments. Palm oil and other vegetable oils led the gains, rising by 37.76 percent.
The United States and India remained key destinations alongside China. Together, the three accounted for 41.53 percent of Indonesia’s non-oil exports.
Imports Tied to China’s Factories
Indonesia’s imports from January to July rose 3.41 percent year-on-year to $136.51 billion. Non-oil imports increased 6.97 percent to $118.13 billion, while oil and gas imports dropped 14.79 percent.
The strongest growth came in imports of machinery and electrical equipment, up 10.04 percent, reflecting industrial demand. Imports of cereals fell 53.66 percent, marking the sharpest decline.
China supplied nearly half of Indonesia’s non-oil imports at $47.67 billion, followed by Japan at $8.77 billion and the United States at $5.75 billion.
Indonesia recorded a trade surplus of $23.65 billion between January and July, driven by a $34.06 billion surplus in non-oil trade that outweighed a $10.41 billion deficit in oil and gas. In July alone, the surplus stood at $4.17 billion.
However, the overall surplus masks a Bilateral deficit with China: ~$13.21 billion (imports $47.67 billion vs exports $34.46 billion), even as Indonesia posted an overall trade surplus.
A Shifting Trade Map
Exports to the United States jumped 23.51 percent to $17.89 billion, and shipments to Singapore climbed 31.85 percent. Exports to Japan dropped 21.11 percent to $8.56 billion, while exports to India fell 12.00 percent to $10.87 billion.
Shipments to ASEAN as a whole rose 19.31 percent, and to the European Union by 12.71 percent, adding regional and transatlantic growth alongside the China trade.
Indonesia’s trade profile shows reliance on China for both export earnings and industrial supply chains. While strong exports to the United States and ASEAN supported the overall surplus, China remained the largest single counterpart on both sides of the ledger.
Any shifts in Chinese demand or supply conditions will directly shape Indonesia’s trade balance, highlighting the scale of economic interdependence between the two countries.
What the Data Says: A Persistent China Deficit Problem
Indonesia likes to point to its trade surplus as a sign of economic strength. From January to July this year, exports jumped past $160 billion, leaving a cushion of more than $23 billion after imports.
Manufacturing and agriculture surged, palm oil sales soared, and the United States and ASEAN neighbors bought more than ever.
But the numbers also show a different reality: Indonesia is more dependent on China than ever, and that dependence comes with risks.
China bought $34.5 billion of Indonesian goods in the first seven months of 2025, about 23 percent of all non-oil exports. At the same time, Indonesia imported $47.7 billion from China, or 40 percent of all non-oil imports.
The result is a $13 billion deficit with its largest trading partner, even as the country celebrates a national surplus.
That imbalance matters because it exposes Indonesia on two fronts. If Chinese demand for steel and nickel weakens, export earnings will shrink. If Beijing curbs shipments of machinery and electrical equipment, Indonesian factories will feel the squeeze. In both cases, the national surplus offers little protection.
The export story is not all bleak. Sales to the United States rose 24 percent, ASEAN 19 percent, and the European Union 13 percent.
Diversification is happening, but not nearly fast enough to dilute China’s dominance. One in every five export dollars still depends on Chinese demand, and two in every five import dollars are tied to Chinese supply.
Indonesia’s economy is stronger than it was a year ago. It is selling more to the world and buying the machinery it needs to keep industrializing.
But the trade data makes one thing clear: Beijing’s choices in demand, pricing, or policy can swing Indonesia’s fortunes more than any other single factor. That is the real story behind the surplus.
Frequently Asked Questions (FAQ)
What share of Indonesia’s non-oil exports went to China in January –July 2025?
China absorbed 22.64% of Indonesia’s non-oil exports, equal to $34.46 billion. The primary commodities were iron and steel, mineral fuels, and nickel and related products.
How much did Indonesia import from China during the same period?
Indonesia imported $47.67 billion in non-oil goods from China, representing 40.35% of total non-oil imports. This was more than five times the value of imports from the United States and over five times those from Japan.
Did Indonesia run an overall trade surplus in Jan–Jul 2025?
Yes. Indonesia’s trade balance was a $23.65 billion surplus, driven by a $34.06 billion surplus in non-oil trade that outweighed a $10.41 billion deficit in oil and gas trade.
What was Indonesia’s bilateral trade balance with China?
Despite the overall surplus, Indonesia ran a bilateral deficit of about $13.21 billion with China (imports $47.67 billion vs exports $34.46 billion).
Which export categories to China were largest?
The biggest export categories to China were iron and steel, mineral fuels, and nickel and related products.
Which import categories grew the most?
The strongest growth came in machinery and electrical equipment, which increased 10.04% year-on-year, reflecting industrial demand. Imports of cereals saw the sharpest decline, falling 53.66%.
Which sectors of Indonesia’s exports performed best in early 2025?
- Manufacturing exports: +17.40%
- Agriculture, forestry, and fisheries: +43.62%
- Mining exports: –25.65%
- Palm oil and vegetable oils: +37.76% (the top gainer)
How did Indonesia’s exports to other key partners shift?
- United States: +23.51% to $17.89 billion
- Singapore: +31.85% to $5.38 billion
- Japan: –21.11% to $8.56 billion
- India: –12.00% to $10.87 billion
- ASEAN (total): +19.31% to $29.90 billion
- European Union: +12.71% to $11.11 billion
Who were Indonesia’s top non-oil import suppliers in Jan–Jul 2025?
- China: $47.67 billion (40.35%)
- Japan: $8.77 billion (7.43%)
- United States: $5.75 billion (4.87%)
- ASEAN countries: $18.94 billion (16.03%)
- European Union: $6.69 billion (5.66%)
How large was Indonesia’s monthly surplus in July 2025?
In July 2025, Indonesia recorded a $4.17 billion surplus, with non-oil exports at $23.81 billion (+12.83% YoY).


